Overview of Shipments: The logistics report for quick and easy shipment volume analysis
The logistics report you need: comprehensive shipment data analysis that gives accurate insights into logistics process
Running an e-commerce business is a constant race against time. It’s not just about getting customers to complete a checkout or delivering the goods to their doorsteps. Being able to quickly visualize shipment data that reveal problem areas and growth opportunities, is critical for making strategic decisions.
What you need is an intelligence report that gives you real-time insights of your shipment volume, the peaks and the lows, and even the distribution of statuses - all of which are key to deriving the state of your logistics health. And you can find exactly that in one of Perform.AI’s best-practice reports, located within our ANALYZE offering - Overview of Shipments.
Here’s a breakdown of the report’s 3 key charts - Shipment Count, Shipments Over Time, and Shipment Status, and how you can best use them to hit your logistics KPIs.
Get a view of how your shipment volume is distributed across countries, carriers, and more
Do you only have a few minutes to check on your e-commerce logistics performance? The Shipment Count chart is for you, giving you an overview of the total number of shipments from three different perspectives - destination country, carrier, and status.
For instance, when viewing the chart by “Destination” country, you will be able to identify the top-performing markets based on the total number of parcels. If you switch the chart variant to “Carrier”, you can tell at a glance how the parcels are being distributed amongst your carrier partners. And viewing the chart by “Status” provides an overview of the percentage of parcels that have been delivered in the selected time period.

Pro tip: Layer on filters such as trade lanes (domestic or international) or even custom tags to gather detailed insights from the chart. You can select as many filters as you like!
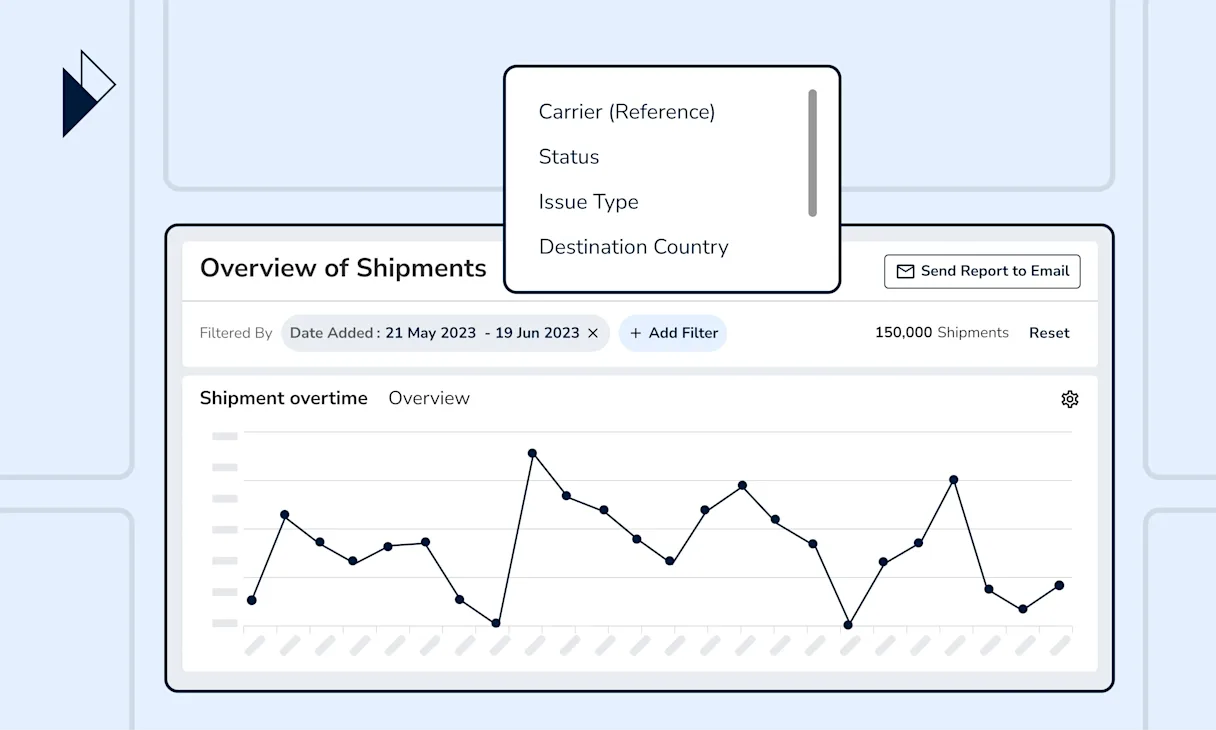
Monitor your shipment volume across any time period you like - by day, week, or month
The Shipment Over Time chart reveals shipment volume trends over the specified time period. Essentially, you can observe your shipment levels by months, weeks, and even days.
And here’s how some of our customers best utilized this chart: First, they would grab a snapshot of the chart. Then, they identify the key business initiatives that happened within the same time period, whether that’s a marketing campaign or a change of carrier partners, and mark them out on the chart. This approach allows them to quickly draw conclusions on specific strategic decisions' impact on their shipment volume.

Pro tip: Noticed a sudden change in shipment volume? Consider examining the Shipment Over Time chart and the Shipment Count chart to identify contributing factor(s).

Quick assessment of logistics performance with the breakdown of shipment status
Gaining insight into how your top carrier partners and target markets are faring in parcel delivery provides the information you need to develop logistics strategies. The Shipment Status chart aids in that with a breakdown of shipment statuses in three areas - carriers, destination countries, and destination states and provinces. At a glance, you can identify issues to tackle such as regions or countries that are experiencing delivery bottlenecks.

Pro tip: Zoom in on identified problems by cross-referencing the “Shipments with Issues per Status” chart in the Overview of Issues, another one of our ANALYZE reports.
A time-saving shipment report = smoother logistics operations
Perform.AI’s Overview of Shipment report is designed to save you time and effort when running your shipment volume analysis. Instead of spending hours and hours consolidating and visualizing large data sets, simply leverage our best-in-class charts and extract real-time, actionable insights in just a few clicks.
Besides the default chart displays, you can apply filters to help you focus on insights that matter. Not only that - you can also capture snapshots of any charts and share them over a message or send the entire report via email to key stakeholders.
Book a demo with our e-commerce logistics experts now and we’ll guide you through the best practices for shipment reporting. Learn how you can easily monitor and improve your logistics operations with data from day 1 with Perform.AI’s industry-leading data.