Overview of Issues: The logistics intelligence that helps identify and resolve shipment issues
Having a clear overview of shipment issues directly impacts customer satisfaction. Here's how.
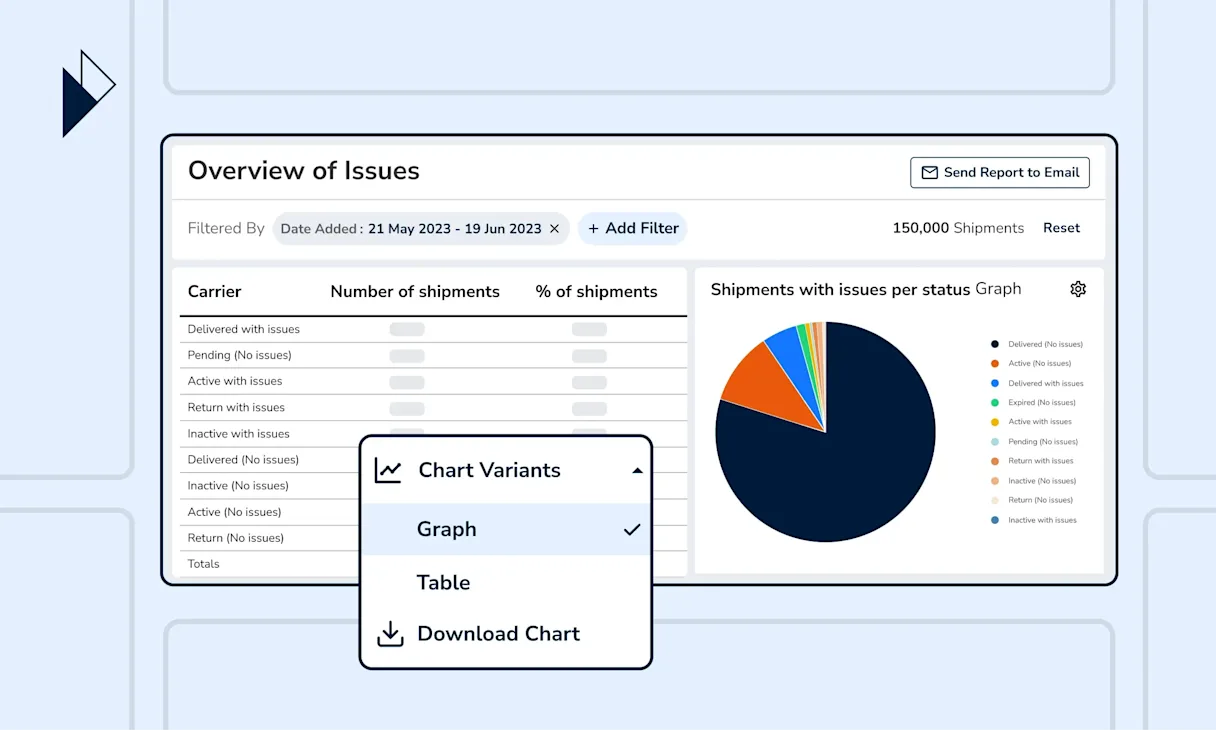
When customers receive a late delivery, they become less likely to shop in your store again. And for every customer who did not return, it costs e-commerce businesses five to 25 times more to acquire a new customer. This is why logistics leaders take resolving shipment issues and optimizing operations for better customer satisfaction very seriously.
However, shipment issues can be extremely complex, especially when most carriers label each issue differently. If you work with multiple carrier partners in many countries, you might end up with various descriptions of the same problem.
With Perform.AI, information across 1,045+ carriers is consolidated and harmonized. As such, we were able to identify as many as 67 standard shipment issues, which are represented in our ANALYZE report - Overview of issues. Through one cohesive view, shipment issue reporting is not only much easier, but also more accurate across all angles, whether that’s carrier, recipient, or merchant-related.
Here’s a breakdown of the report's 4 key charts, Shipment with Issues per Status, Issues Over Time per Issue Type, Shipments with Issues against Total Shipments, and Issue Type Distribution, and how you can best use them to resolve issues in the supply chain and last mile delivery process.
Get a quick sense of whether shipment issues are a cause for concern
Shipment issues are common along the e-commerce logistics journey. But how do you determine whether you should be concerned about them? This is where the Shipment with Issues per Status chart can help - showing the volume of shipments with issues broken down by shipment status.
Here’s our recommendation on best utilizing the chart: First, establish an internal issue threshold. For example, what is the percentage of delivered shipments with issues your business is willing to tolerate before threatening your logistics operations KPI? Then, benchmark the reported percentage from the chart against your threshold.
Finally, determine the next steps - whether that’s taking the time to conduct further analysis or immediately mobilizing more resources to resolve the issues.

Pro-tip: Instead of tackling all issues at once, try zooming into a selected few shipment statuses. Simply apply the corresponding filter (e.g., Status: Delivered, Return) within the report.
Discover which are the top issues happening at which time of the week, month, or year
The Issues Over Time per Issue Type chart shows a breakdown of shipment issue types over specific periods. You can choose to monitor the issues over days, weeks, or even months simply by applying report filters.
The chart is available in 2 variants. The bar graph helps to identify season-related issue trends. For instance, recipient-related issue types may increase during the summer holidays when customers are home less often. This way, your logistics operations team can anticipate issues and allocate the necessary resources to tackle them.
The corresponding table shows a detailed breakdown of the exact shipment count with issue per issue type, helping you prioritize the ones that require immediate attention.

Pro-tip: Utilize the Issues Over Time per Issue Type chart to evaluate the effectiveness of the solutions you’ve implemented, by comparing the percentage of shipments with issues with that of the previous days, weeks, months, or years.
Deep dive into the state of your shipment health
Anomalies in logistics reporting typically send an alarming signal about the state of the delivery operations. The Shipment with Issues against Total Shipment chart helps uncover such exceptional circumstances by displaying two key metrics - the percentage of shipments with issues against the total number of shipments over the same period.
When both values consistently follow the same, your shipments are generally in a healthy state. However, if one value is too high or too low (e.g., shipment volume is decreasing and yet the percentage of issues is increasing), this reveals an anomaly in your delivery operations and may require further investigation.

Pro-tip: To identify the exact issue causing the anomaly, examine the Shipments with Issue against Total Shipments chart and the Issues Over Time per Issue Type chart together. On top of that, view the chart by days or weeks for an accurate picture of how issues trend against shipment volume.
Pinpoint what are your top shipment bottlenecks
Identifying your top shipment issues is the critical first step to investigating delivery bottlenecks. The Issue Type Distribution chart helps by showing the most common issue your business is facing. With that information, it becomes much easier to prioritize the issue to fix first.
For example, if most of the issues are recipient-related, you can consider sending your customers notifications asking them to update their delivery address or reschedule a more convenient delivery date.

Pro-tip: Utilize the report filters to drill down into country and carrier-specific issue type distribution.
Faster, simpler, and more accurate shipment issue reporting = happier customers
Perform.AI's Overview of Issues report is designed to give an accurate overview of shipment issues. Together, the four key charts let you determine if a delivery bottleneck is due to a specific carrier, seasonal behavior, or a missing customer engagement touchpoint (e.g., lack of notifications with an accurate delivery date). Instead of spending hours decoding complex data, logistics leaders can now focus on issues that require their attention.
Besides the default chart displays, you can apply filters and view the charts from various perspectives. Not only that - you can also capture snapshots of any charts and share them over a message or send the entire report via email to key stakeholders.
Book a demo with our e-commerce logistics experts now, and we’ll guide you through the best practices for shipment reporting. Learn how you can easily monitor and improve logistics operations with data from day 1 with Perform.AI’s industry-leading data.