How to Cut Reverse Logistics Cycles to Under Five Days
Compress your reverse logistics cycle time. Benchmark your return stages and stop seasonal inventory depreciation.
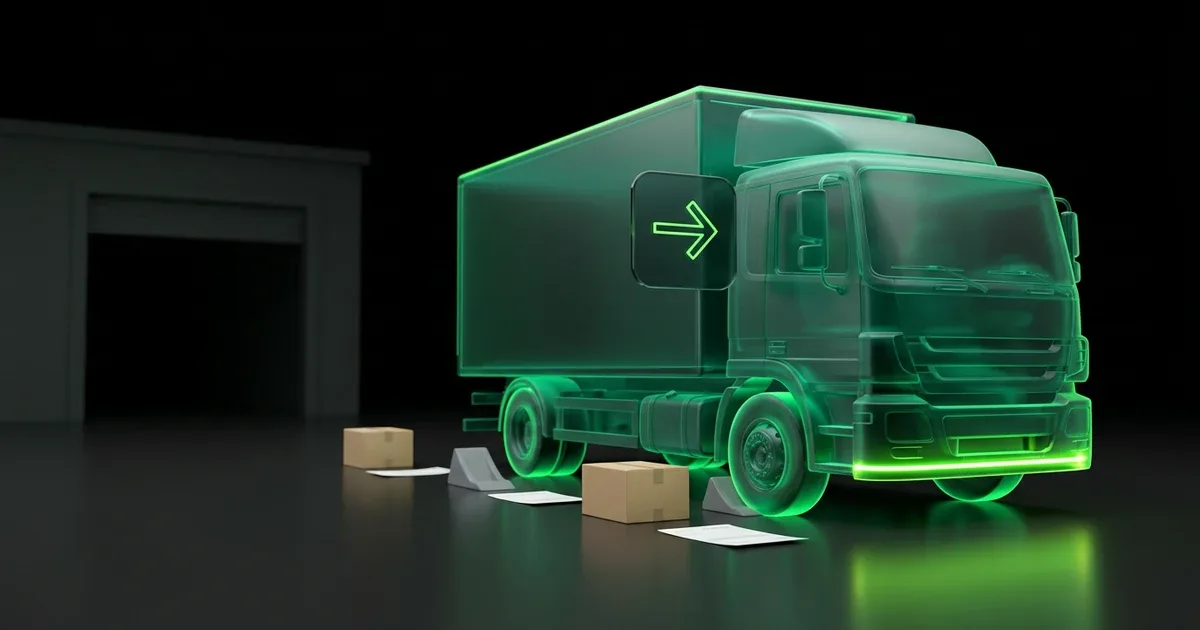
Standard e-commerce reverse logistics takes 12 to 18 days from customer initiation to warehouse restocking, though integrating automated drop-offs and dynamic carrier routing cuts total cycle time down to under five days.
What is return cycle time in reverse logistics?
Measuring the total duration required to move a product from the buyer's hands back into available inventory exposes exactly where margin leaks.
Return cycle time is the duration from customer return authorization through carrier transit, facility intake, grade-and-disposition, and inventory reinstatement.
For global retailers, regulatory frameworks dictate the front end of this timeline. Under European Union consumer regulations, buyers have a minimum 14-day right of withdrawal to cancel and return online purchases without giving any reason (European Commission, 2024). Once that request is logged, the operational clock starts. Measuring this cycle accurately requires tracking every handoff between the customer, the carrier, and the warehouse.
Supply chain teams struggle to measure this end-to-end timeline when data lives in fragmented systems. The e-commerce platform records the return merchandise authorization, the carrier portal holds the transit scans, and the warehouse management system logs the final intake. Without a single, unified record, operations managers rely on estimated averages rather than precise tracking. Understanding the true cycle time requires separating the customer-facing resolution—when the refund is issued—from the physical asset recovery. While a brand might refund a shopper upon the first carrier scan to improve customer satisfaction, the operational cycle remains open until that specific SKU is inspected, graded, and placed back on the active pick path.
When operations teams cannot track the physical movement of goods, they cannot accurately forecast warehouse labor or restock availability. A return that takes three weeks to process represents trapped capital and lost sales opportunities. Setting clear benchmarks for each phase of the return journey is the first step toward regaining control over inventory velocity and protecting gross margin.
How do e-commerce return cycle benchmarks break down by stage?
Operations teams cannot compress a timeline they do not measure. A standard reverse logistics benchmark breaks down into four distinct stages, each carrying its own inherent friction.
First, the customer drop-off window typically consumes three to five days. Shoppers often initiate a return online but wait until the weekend to visit a post office or print a label. This initial latency is entirely out of the carrier's control but severely extends the total cycle. The first mile delivery phase is notoriously unpredictable when retailers rely on consumers to source packaging and locate drop-off points.
Second, hub consolidation adds two to four days. When retailers use economy return services, regional carriers group parcels at local depots to build cost-efficient truckloads. Parcels sit idle until enough volume accumulates to justify the linehaul movement. Variations in dimensional weight and packaging irregularities further complicate this consolidation, often requiring manual sorting that delays the shipment.
Third, linehaul transit time takes three to six days depending on the distance to the central processing facility. Cross border logistics or shipments moving from rural areas to centralized distribution centers often experience extended transit times, exacerbated by limited tracking visibility during the handover between local postal services and international logistics providers. Customs clearance can add unpredictable delays to international returns, holding up valuable inventory at borders.
Finally, warehouse intake and grading require two to three days. Upon arrival, facility staff must unpack the item, verify its condition against the return reason, clean or repackage it, and update the inventory system. Cumulatively, this creates a 12 to 18-day blackout period where inventory is financially tied up but physically unavailable to sell. Retailers relying on fragmented networks often see these timelines stretch further during peak seasons, which is why AI returns management needs carrier data to accurately track inbound volume and anticipate warehouse labor requirements.
Why does return latency erode enterprise gross margins?
Every day a product spends in the return network is a day it loses value. Total retail returns are projected to reach $849.9 billion in 2025, with an estimated 19.3% of all online purchases returned (National Retail Federation, 2025). When nearly one-fifth of inventory flows backward, transit latency becomes a severe margin drain.
Seasonal apparel, fast-fashion, and consumer electronics depreciate rapidly. An item that takes three weeks to restock often misses its primary selling window. By the time a winter coat is returned, processed, and made available for purchase, the retailer may have already initiated end-of-season markdowns. This forced discounting directly erodes gross margin, turning a potentially profitable recovery into a net loss. The longer the cycle time, the higher the probability that the item will be sold at a clearance price or written off entirely.
Slow return cycles drive up customer service contact volume. Shoppers waiting weeks for a refund initiate support tickets, asking about the status of their returned parcel. Each of these inquiries increases the total cost to serve. If the customer service team cannot see the return transit data, they cannot provide a definitive answer, leading to frustration and decreased customer lifetime value. A predictable, fast return process is a critical component of brand loyalty, and delays directly damage repeat purchase rates.
Trapped working capital restricts a retailer's ability to procure new stock. When millions of dollars of inventory are suspended in transit or sitting on a receiving dock, the business cannot reinvest that capital into fast-moving product lines. Accelerating this process is critical for cutting reverse-logistics cost and maintaining healthy cash flow. Operations leaders must treat return cycle time as a primary driver of enterprise profitability.
How can operations teams compress the reverse logistics cycle?
Compressing the return cycle requires structural changes to how parcels enter and move through the network. Operations teams achieve the fastest reductions by shifting away from slow, economy postal routes and simplifying the customer handover.
Transitioning to consolidated drop-off networks is the most effective first step. When shoppers utilize local lockers, retail service points, or printerless QR code drop-offs, carriers bypass the inefficient first-mile residential collection. This shaves days off the initial stage and provides an immediate, verifiable tracking scan that triggers downstream workflows. Shoppers prefer the convenience, and retailers benefit from the accelerated timeline and reduced collection costs.
Automated carrier selection further accelerates transit. Instead of routing all returns through a single default provider, dynamic shipping rules assign the fastest or most cost-effective carrier based on the item's current location, its dimensional weight, and its resale value. A high-margin electronics item can be routed via an express carrier to ensure rapid restocking, while lower-value goods utilize standard ground networks. This flexibility ensures that logistics spend aligns with the financial value of the recovered asset.
Pre-sorting and intelligent disposition routing ensure that inventory moves to the right facility on the first attempt. Rather than sending all returns to a central warehouse for inspection, operations teams can configure rules to route damaged goods directly to liquidators or recycling centers. This prevents dead stock from clogging the primary fulfillment center and lets warehouse staff focus on grading and restocking pristine, sellable items. Implementing these strategies is foundational for e-commerce returns management solutions that protect inventory value and maintain high operational efficiency.
Accelerating return cycles with connected commerce operations
Fragmented systems force operations teams to manage outbound shipping, return policies, and warehouse intake in silos. Integrating AI into reverse logistics workflows enables automated routing and disposition, reducing the cost and manual friction of handling returns (Deloitte, 2024).
Perform.AI runs checkout, post-purchase, and returns on one connected system, built on 1,100+ global carrier integrations. The Returns component gives shoppers access to 700,000+ drop-off points, accelerating the first mile and triggering immediate tracking. Underneath, Logistics executes the dynamic carrier routing, ensuring high-value items take the fastest path back to the warehouse, while simultaneously auditing the return shipping costs against contracted rate cards.
Because the entire journey runs on one dataset, AI Decision Intelligence tracks carrier SLA compliance in real time. Supply chain leaders can set specific transit time expectations for the return leg using Performance Aspirations, and the system automatically flags which carriers or routes are breaching those standards. Instead of waiting for a monthly report to discover that a regional carrier is causing a five-day delay, operations teams are alerted immediately and can adjust their routing rules to protect their inventory velocity.
By treating the return journey as a connected operational workflow rather than an afterthought, retailers can restock inventory days faster and protect their gross margin. Book a demo to see how Perform.AI accelerates reverse logistics and turns trapped inventory back into available revenue.
Frequently Asked Questions
How long does reverse logistics take for e-commerce returns?
Standard e-commerce reverse logistics takes 12 to 18 days from the moment a customer initiates a return until the item is restocked in the warehouse. This timeline includes customer drop-off, hub consolidation, linehaul transit, and final facility grading. Retailers using dynamic routing and automated drop-off networks often compress this cycle to under five days.
What are the benchmarks for e-commerce return cycle time?
A typical benchmark breaks down into three to five days for customer drop-off, two to four days for hub consolidation, three to six days for linehaul transit, and two to three days for warehouse intake. Measuring performance against these specific stages helps operations teams identify bottlenecks and optimize carrier selection.
What stages make up the e-commerce return cycle?
The e-commerce return cycle consists of return authorization, first-mile collection or drop-off, regional hub consolidation, linehaul transit to the processing facility, and final warehouse intake. The cycle officially ends when the item is inspected, graded, and reinstated into active inventory for resale.
How can operations teams reduce return transit times?
Operations teams reduce transit times by shifting from residential pickups to consolidated drop-off networks, which accelerates the first mile. Implementing dynamic carrier routing ensures high-value items are assigned to faster express networks, while pre-sorting rules route damaged goods directly to liquidators, bypassing the central warehouse entirely.
Why does return latency hurt seasonal inventory margins?
Return latency hurts margins because seasonal items depreciate rapidly. An item that takes three weeks to restock often misses its primary selling window, forcing the retailer to apply deep markdowns. Slow return cycles trap working capital and turn potentially profitable inventory recoveries into net losses.